Managing a business’s financial health can often feel like navigating a labyrinth of numbers and complex reports. However, with the integration of QuickBooks and Power BI, businesses can now have a dynamic and comprehensive financial dashboard at their fingertips. The QuickBooks Power BI Standard Dashboard transforms raw data into a visually intuitive and interactive experience, making financial management not only more accessible but also more insightful.
Streamlined Navigation for Efficient Analysis The dashboard features a clean, organized layout with a dedicated navigation panel, allowing users to seamlessly switch between various financial reports such as Profit & Loss, Balance Sheet, and Cash Flows. This level of organization ensures that critical financial data is always just a click away, empowering business owners and financial managers to make informed decisions swiftly.
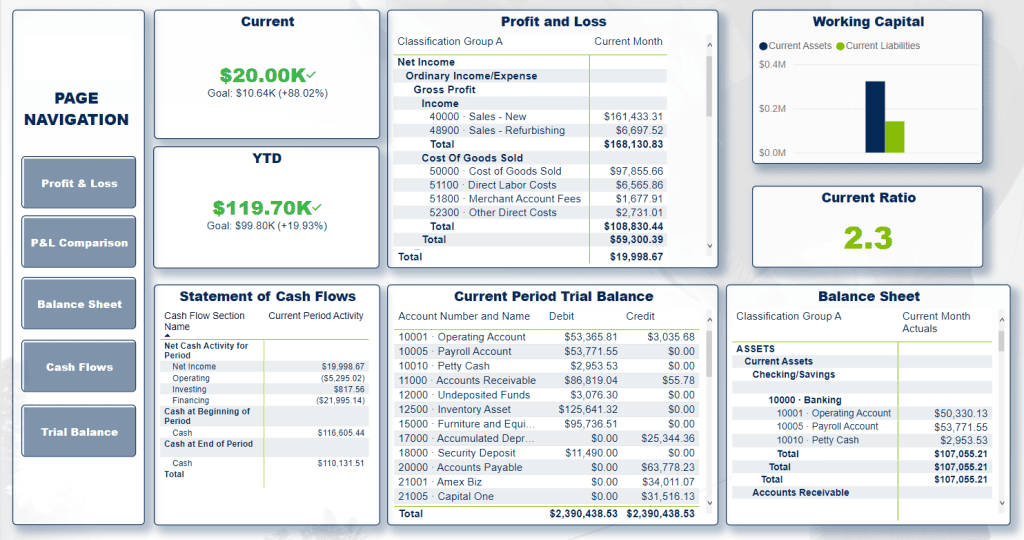
Real-Time Financial Performance Tracking At the heart of the dashboard is the real-time tracking of financial performance. Key metrics such as current income, year-to-date figures, and comparative budget analysis are displayed prominently. These figures aren’t just static numbers; they are benchmarks that illustrate the business’s financial trajectory with goals and percentage changes to provide context to the performance.
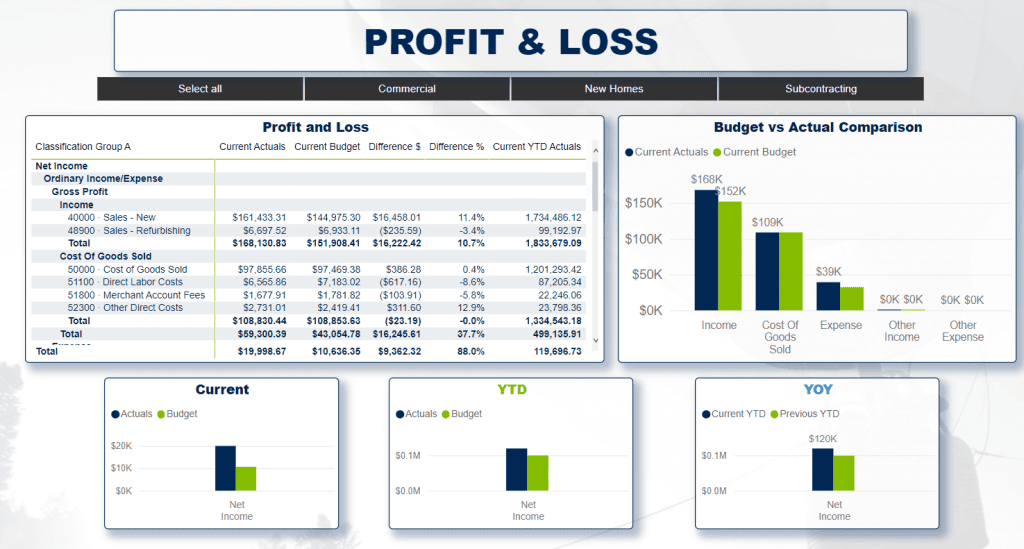
In-Depth Profit and Loss Insights The Profit and Loss section of the dashboard breaks down net income with extraordinary detail, categorizing revenue and expenses into clear, manageable segments. Users can quickly identify the most significant income sources, as well as areas where costs might be trimmed. The dashboard also allows for a direct comparison with budgeted figures, offering a transparent view of financial planning versus actual performance.
Liquidity at a Glance Understanding a business’s liquidity is crucial, and the QuickBooks Power BI Standard Dashboard simplifies this with clear visualizations of working capital and current ratios. These graphs offer a snapshot of the company’s ability to meet short-term obligations, a key indicator of financial stability.
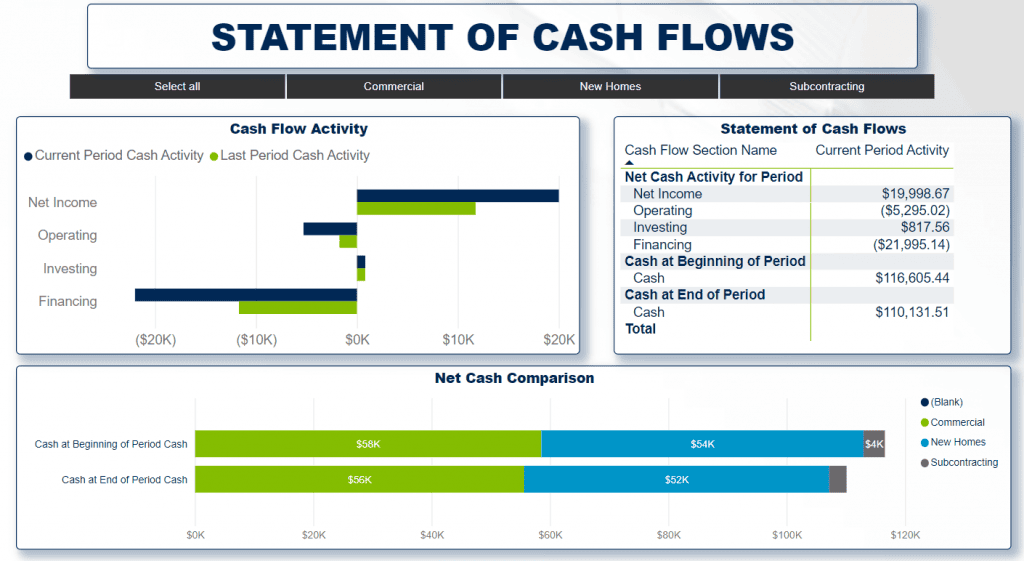
Comprehensive Cash Flow Management Cash flow management is made simple with a dedicated Statement of Cash Flows section. This part of the dashboard visually breaks down cash movements across operating, investing, and financing activities. It also presents a comparative bar chart of net cash at the beginning and end of the period, providing a clear picture of the business’s cash flow health.
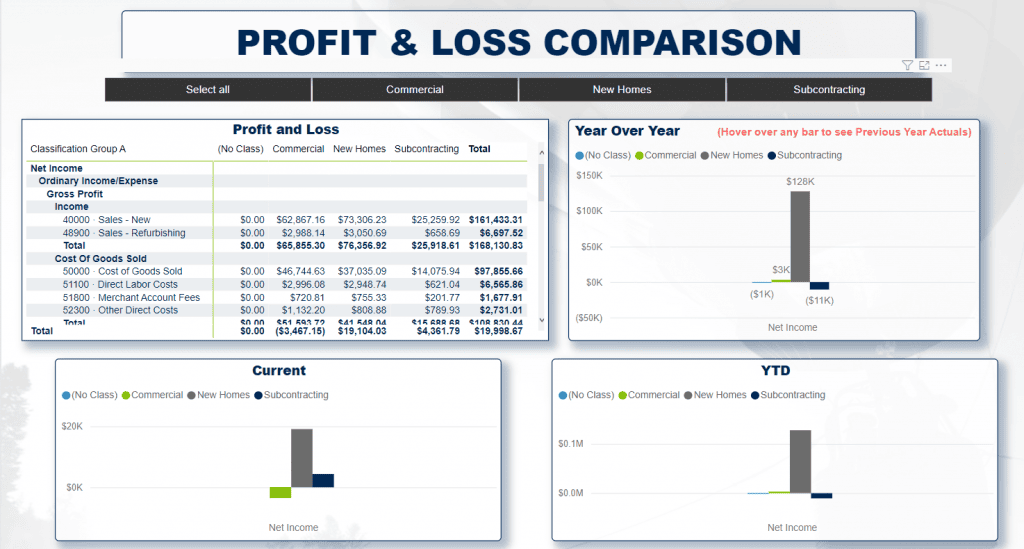
Year-Over-Year Financial Evolution The dashboard also includes a Year-Over-Year comparison, allowing businesses to measure their financial growth against previous periods. This perspective is invaluable for long-term financial planning and assessing the effectiveness of business strategies.
Tailored Financial Reporting One of the most significant advantages of the QuickBooks Power BI Standard Dashboard is its ability to tailor financial reporting to specific business segments. Whether it’s commercial operations, new homes, or subcontracting, the dashboard provides customized views to cater to various business models.
Simplifying the Complex The QuickBooks Power BI Standard Dashboard takes the complexity out of financial data, presenting it in a way that is both accessible and actionable. With its comprehensive range of financial reports, interactive charts, and real-time data, it’s more than just a reporting tool—it’s a roadmap to financial success.
In today’s fast-paced business environment, having a tool like the QuickBooks Power BI Standard Dashboard isn’t just convenient—it’s essential. It empowers businesses with the insights needed to drive growth, manage risks, and stay ahead in the competitive landscape.