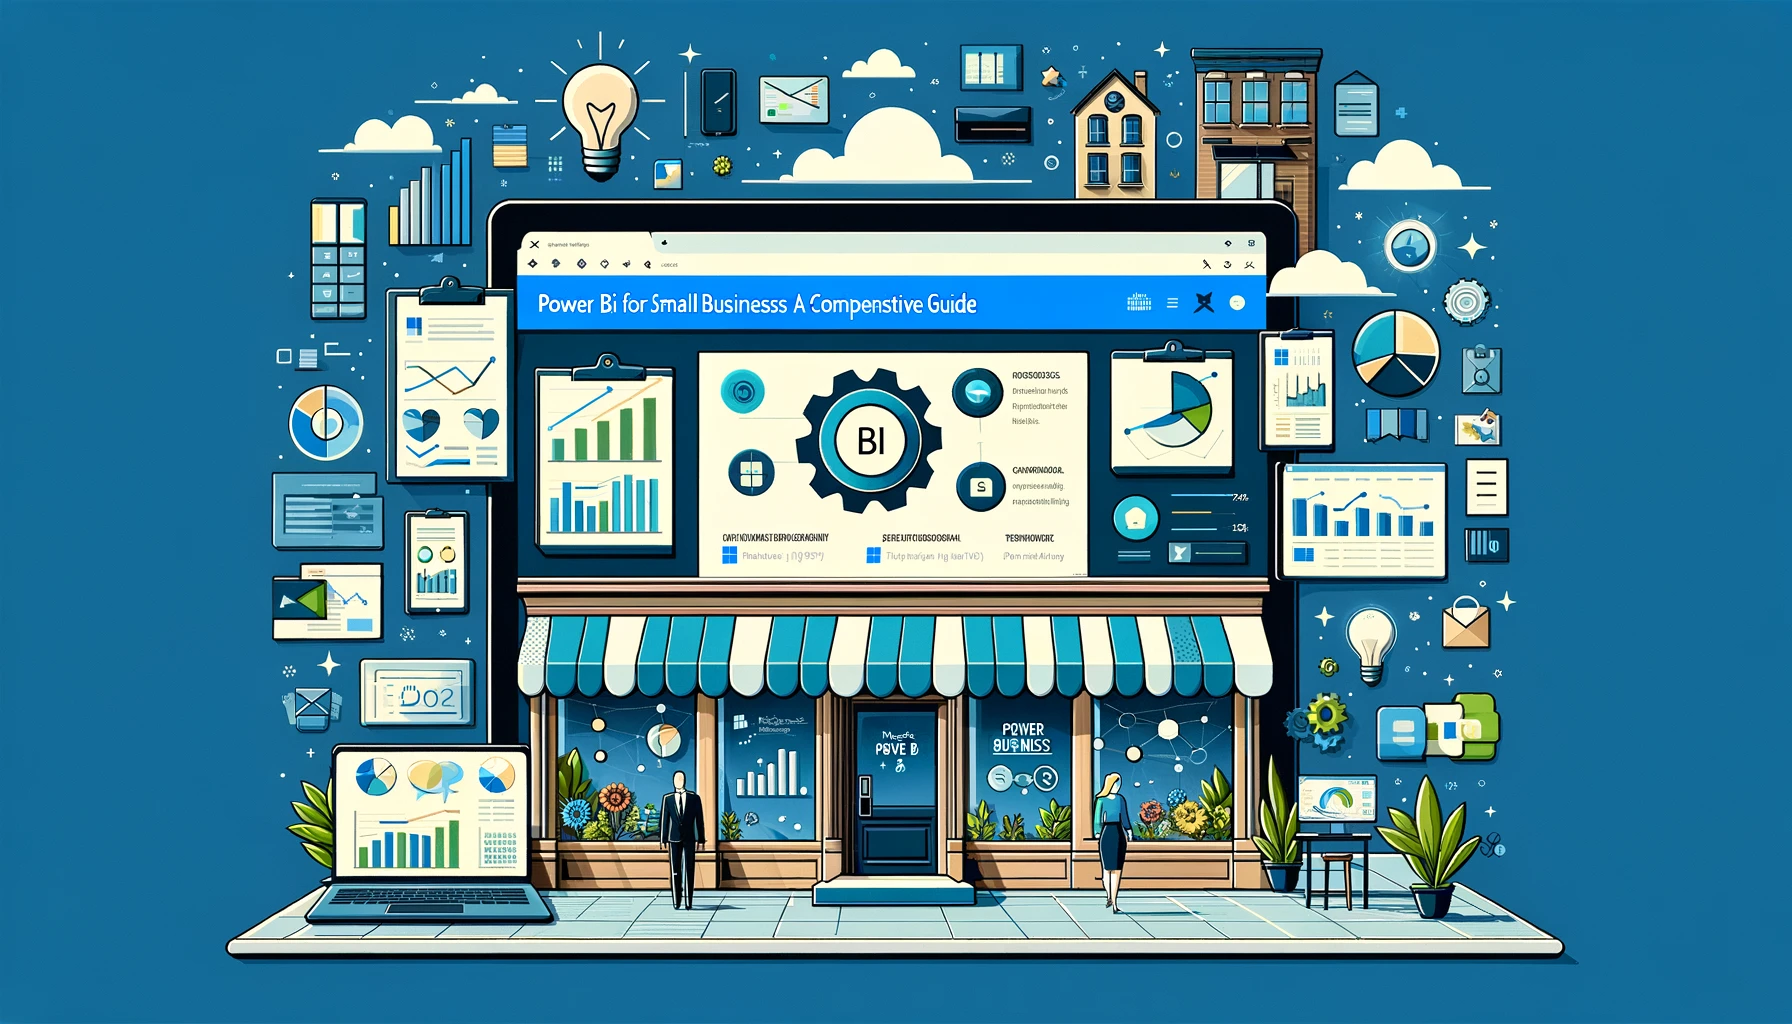

In the dynamic world of small businesses, data is the lifeline that informs strategic decisions, unveils opportunities for growth, and identifies inefficiencies that could be costing you money. However, the challenge often lies in how to effectively gather, analyze, and act on this data. This is where Microsoft Power BI, a powerful business analytics tool, comes into play. This comprehensive guide is designed to introduce small business owners to the capabilities of Power BI, helping you transform raw data into actionable insights.
Microsoft Power BI is a suite of business analytics tools that allow users to connect to a wide array of data sources, clean and transform the data, and then create rich, interactive reports and dashboards. It enables businesses of all sizes, but especially small businesses, to visualize their data in a way that is accessible, understandable, and actionable.
Power BI offers a cost-effective solution for small businesses looking to leverage advanced analytics. With a free desktop version and a low-cost Pro version, it provides small businesses with an affordable entry point into the world of business intelligence.
One of the key benefits of Power BI is its user-friendly interface. Small business owners can quickly learn how to create dashboards and reports without needing a background in data science or IT.
As your business grows, so too can your use of Power BI. It’s designed to scale from a single user to large enterprise teams, ensuring it can continue to meet your needs over time.
Power BI seamlessly integrates with many common business applications and data sources, including Excel, SharePoint, and a wide range of cloud-based services. This makes it easier to pull in data from different areas of your business for a holistic view.
The first step is to download Power BI Desktop. It’s free and offers a robust set of tools for data analysis and report creation. For sharing reports and dashboards with your team, you’ll need Power BI Pro subscriptions, which allow for collaboration and more extensive publishing options.
Power BI can connect to almost any data source, from Excel spreadsheets to databases, and cloud services. This flexibility allows you to bring together data from various aspects of your business for a comprehensive analysis.
Once your data is in Power BI, you can start creating reports and dashboards. Power BI provides a wide range of visualization tools, from basic bar charts to complex scatter plots and custom visuals. These tools allow you to present your data in a way that is most meaningful for your business.
With your reports and dashboards created, you can easily share them with your team. If you’re using Power BI Pro, you can publish them to the Power BI service, allowing your team to access insights from anywhere, at any time.
Power BI offers small businesses a powerful platform for making data-driven decisions. Its cost-effectiveness, ease of use, and scalability make it an ideal choice for businesses looking to get started with analytics. By following the steps outlined in this guide, you can begin to unlock the full potential of your data, helping to drive growth and efficiency in your business. Remember, the journey to data-driven decision-making is a marathon, not a sprint. Start small, stay focused, and continue to learn and adapt as you go.